


Study site and ethical considerations
This study complied with all relevant ethical regulations and was approved by the Yale Human Investigations Committee, National DÉthique De La Recherche Pour La Sante Humane in Cameroon, and The Centre Hospitalier et Universitaire de Yaoundé. Informed consent was obtained for every participant enrolled in the study and compensation was given at each visit. Our study was conducted in Yaoundé, the capital of Cameroon, with a population of 3 million inhabitants. Malaria is holoendemic with two distinct rainy seasons and a wide range of entomological inoculation rates (0–90.0 infective bites per person per year)55. The Yale, UAMS and Cameroonian teams were onsite in February 2020, with the UAMS team supervising the technical aspects of the device and the Yale and Cameroonian teams responsible for all clinical and molecular protocol aspects. Due to the COVID-19 pandemic travel restrictions, US-based teams had to leave Cameroon in March 2020, while a local Cameroonian team member was trained on how to acquire data with the Cytophone, and enrollment and follow-up under COVID-19 guidelines were continued for the duration of the study.
Regulatory approvals and study site setup
This research study was initiated under a Research Collaboration Agreement (Memorandum of Understanding) between the University of Arkansas for Medical Sciences and the Yale School of Public Health (YSPH) in 2019. The Yale Human Investigations Committee (HIC) determined Cytophone to be an NSR device with abbreviated Investigational Device Exemption (IDE) requirements under the FDA Code of Federal Regulations Title 21 812.2. Yale HIC approved the clinical protocol, followed by approval at the National D’Éthique De La Recherche Pour La Sante Humane in Cameroon (CNERSH) and The Centre Hospitalier et Universitaire de Yaoundé (CHUY). The Cytophone was then shipped from YSPH to Médecins Sans Frontières (Doctors without Borders) Epicentre (MSF Epicentre) in Yaoundé, Cameroon, under a Material Transfer Agreement in January 2020. The study device was set up in a dedicated study room on the medical campus of CHUY, the University Teaching Hospital of Yaoundé.
The Yale, UAMS, and Epicentre teams were present for the device set up in February 2020, with the UAMS team supervising technical aspects of the Cytophone device, including calibration within the dedicated room, and the Yale and Cameroonian responsible for all other protocol aspects, including participant recruitment, clinical management, follow-up, and testing, as well as laboratory assays. While it was the intent for Yale personnel to remain on hand for the entirety of patient recruitment, the COVID-19 pandemic necessitated that a local Cameroonian team member be trained in the use of the Cytophone. We estimate that a total of ~4–5 h was sufficient for initial training to use the Cytophone. However, further training is needed to understand the theory of operation and to perform data analysis. Due to COVID-19 travel restrictions, all international teams left Cameroon in March 2020, and locally trained staff continued enrollment and follow-up under COVID-19 infection control and prevention guidelines, alongside daily email/phone communications and weekly multi-site teleconferences (e.g., Zoom® meetings) throughout study participant involvement.
Participant recruitment and clinical follow-up
Our study was conducted in two consecutive phases: (1) a training cohort assessed at a single visit for initial device optimization and safety assessments and (2) a separate longitudinal study cohort seen for up to 5 visits spanning up to 37 days to assess diagnostic performance and safety (Supplementary Fig. 1). All participants were adults presenting with uncomplicated malaria. The longitudinal cohort was seen on days 0 (the day of diagnosis and start of treatment), 1, 3 [±1 day], 7 [±3 days], and 30 [±7 days]. A goal of this longitudinal design was to provide samples with declining parasite densities and complete clearance (negative samples), as it was anticipated that quantitative PCR (qPCR) would be negative by day 30 in nearly all participants, with low probability of reinfection in this setting. Inclusion criteria for both cohorts were the following: adults age ≥ 21 years with uncomplicated malaria confirmed by either RDT or blood smear microscopy, willingness to adhere to the protocol, and residence in Yaoundé. Exclusion criteria included the following: diagnosis of severe malaria, a history of severe mental illness, presence of known hemoglobinopathies, cancer undergoing active treatment, pregnant (pregnancy testing done at enrollment) or breastfeeding women, and recent receipt of antimalarial therapy within 2 weeks to 12 h of enrollment. Although children, pregnant, and breastfeeding women have the greatest risk of malaria-related morbidity and mortality, they were excluded from this study because of the need to conduct an initial safety assessment of the device before expanding to include more populations. There were no exclusion criteria in this study based on sex, although pregnant and breastfeeding individuals were excluded because of the novel, first-in-human assessment of our technology because of the increased vulnerabilities of those groups. Sex was self-reported by participants, and gender was not considered in the study design. Sex-and gender-based analyses were not performed in this study given that we did not expect sex or gender to have an impact on the diagnostic performance of our device. Study staff recruited participants from the University Teaching Hospital of Yaoundé or nearby clinics. Following informed consent, a brief questionnaire and clinical exam were conducted to obtain details on patient demographics and clinical presentation. Upon confirmation of malaria diagnosis, participants were provided artemether-lumefantrine taken orally twice a day for 3 days, following Cameroonian and international guidelines56. At each visit, we performed Cytophone assessment and collected venous blood (5 mL in EDTA tubes) for thick and thin smears, an RDT, and storage on Whatman® FTA® Cards (MilliporeSigma, Inc.).
PAFC-based Cytophone device
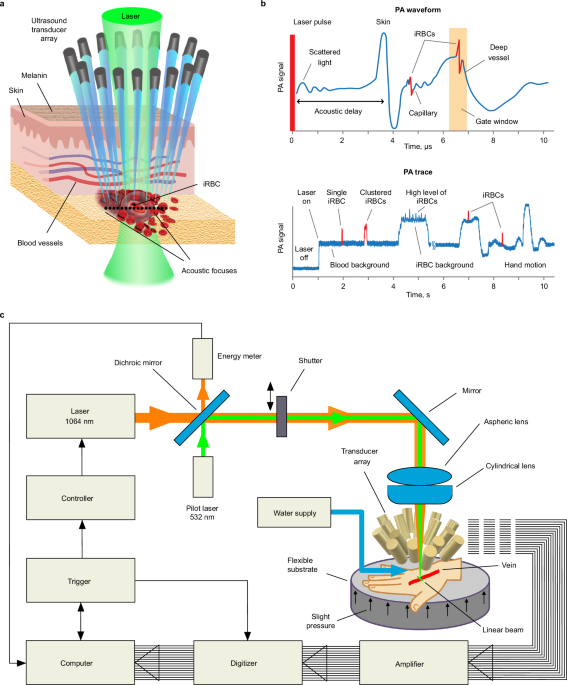
The Cytophone for malaria prototype (Figs. 1 and 2) was built using a near-infrared (NIR) laser (Wedge HB, Bright Solutions, Caru Carpignano, Italy) with the following parameters: wavelength,1064 nm; pulse width, 1.5 ns; pulse repetition rate, 1–2 kHz; and pulse energy on the skin, 240 µJ. For navigation and visualization, a low-power continuous-wave laser (532 nm, 4.5 mW, model CPS532, Thorlabs, Inc.) was adjusted collinearly with the NIR laser beam with dichroic mirrors (Di02-R561; Semrock). A linear laser beam with dimensions of 11 × 1500 μm was formed by assembling aspheric (C560TME-C) and cylindrical (LJ1918l1-C) lenses (Thorlabs Inc.) having an antireflection coating and a focal distance of 12.7 mm. During the course of the study, trained staff performed periodic laser alignment control with a built-in CCD camera (DCC1645C; Thorlabs). Additionally, real-time laser energy with a USB-based energy meter was monitored (PM100USB, S314C head; Thorlabs).
To improve the signal-to-noise (blood background) ratio (SNR), we developed an innovative ultrasound transducer array with 16 customized focused spherical transducers with the following parameters: diameter, 2.4 mm; focal lengths, 3–7 mm; frequency, 40–50 MHz; and resolution, 70–90 µm. The 16-transducer array provides a range of acoustic focal spot positioning, at 0.5, 1.0, 1.5, 2.0, and 2.5 mm depths below the skin surface, in clusters of 3, 4, 3, 3, and 3 transducers, respectively, enabling detection of iRBCs at different vessel locations. The transducers were fixed into a customized holder that was built using a high-resolution stereolithography 3D printer (Form 2, Formlabs, Inc.). Water was used for acoustic coupling between the transducers and the participant’s skin. Within the transducer holder, a 3 × 5-mm central oval was present for laser beam propagation, and two small holes were used for water delivery and suctioning (Supplementary Fig. 3a).
A 16-channel amplifier (Flash Amp, PhotoSound Inc., Houston, TX, USA) was used to amplify PA signals from the transducer array. The PA signal acquisition system for the Cytophone device consisted of a data acquisition board (ATS9416, AlazarTech), a laptop computer (XPS 13, Dell), and a pulse generator (Sapphire 9200, Quantum Composers Inc., Bozeman, MT, USA). The acquisition board was housed in a PCIe card expansion system (Echo Express SE I, Sonnet Technologies, Irvine, CA. We developed The Cytophone software in MATLAB v.9.2 (The MathWorks, Inc.). The laser was triggered at 1 kHz and the pulse generator provided synchronization between laser pulses and data acquisition.
PA signal sampling and processing
The Cytophone device sampled PA signals at a rate of 100 MHz. To increase the SNR, we averaged four consecutive PA signal waveforms. These signal waveforms were then transformed into PA traces using their peak-to-peak amplitudes, similar to those produced in standard flow cytometry32. The PA trace baseline corresponded to background signals from uninfected RBCs. When iRBCs containing the target Hz pass through the area of the vessel under assessment by the Cytophone device, they absorb more laser energy and produce a stronger PA signal which appears as a positive peak above the uninfected RBC blood background trace. The widths of these PA peaks correspond to the time-of-flight of the iRBCs through the detection volume.
We eliminated background fluctuations using a high-pass filter (10 Hz cutoff frequency) before peak detection. The threshold for peak detection was determined using the equation PAth = m + k*IQR, where m is the median, IQR is the interquartile range of the trace, and k is a constant determined from control experiments. The envelope of background signals in the PA trace varies depending on the blood vessel size and other factors (e.g., skin pigmentation, hairs, hand movements, flow dynamics, and laser energy fluctuations) during in vivo measurements. To reduce the influence of these factors, we programmed the software to analyze the PA trace in 10-second-long windows, and PA data were recalculated in each window. Once the software identifies PA peaks, it measures peak properties such as normalized amplitude and full width at half maximum. During post-processing, we manually checked the trace for artifacts and visualized the PA signal. Signal shape, width, and time delay-related selection criteria were used to identify and exclude any artifact-associated PA peaks.
In vitro and in vivo Cytophone assessment
Initial Cytophone assessments were performed in vitro using vessel and cell phantoms to establish fluctuations in the PA trace baseline caused by electronic noise, the influence of scattered light, instability of the laser energy, acoustic environmental noise, vibration, and sample motion. For Cytophone in vivo testing, hand images were taken in the area where the device was focused before and after assessment for grading of local skin pigmentation using a system with three simplified categories: dark, medium, or light. While seated, the participant placed their hand on a flexible foam substrate beneath the PA probe. The participant’s hand was adjusted until the selected vessel was directly below the PA probe, and the probe was then lowered until it made contact with the interface of contaminant-free water for acoustic coupling. Participants could request that the Cytophone assessment stop at any point. We considered a PA contrast usable for navigation and detection of Hz if the PA signal from the vessel was above the established noise threshold and more than 1.3–1.5-fold higher than the PA signal from surrounding skin tissue. NIR imaging (AV300M, AccuVein Inc., Palatine, IL, USA) was also used for vessel visualization. The median duration of trace time analyzed per visit for an individual participant was 14 min (range 2–24 min). Cytophone data analysis was performed by the UAMS software specialist.
Conventional malaria diagnostics
Thick and thin blood smears were stained using 10% Giemsa for 15 min. All blood smears were read independently by two trained microscopists, one of whom is a WHO level 2 certified microscopist. Study microscopists calculated parasite densities from thick blood smears by counting the number of asexual parasites per 500 leukocytes, assuming a leukocyte count of 8000/µL, providing a detection limit of 16 parasites/µL. We declared a sample negative (below the limit of microscopic detection) when no asexual parasites were seen after counting 500 WBCs. A third microscopist read any discrepant speciation or quantitative results if a >25% difference between the two readings was noted; we reported concordant species and median quantitative values. All participants were tested at each visit with a CareStartTM Malaria Ag Pf/Pan COMBO RDT (catalog #RMRM-02571; WHO-prequalified histidine-rich protein 2/lactate dehydrogenase RDT) per manufacturer’s instructions.
Molecular diagnostics
Blood samples were shipped from Cameroon to YSPH on dry ice in March 2021. To extract nucleic acid from the samples, 6 mm hole punches of filter paper from each sampling point were placed in individual Eppendorf tubes with 1 mL of 10% saponin in PBS (phosphate buffered saline) and stored overnight at 4 degrees Celsius46. After rinsing in PBS, the samples were incubated for 10 min in a heat block at 95 °C in 1 mL of Chelex 100 (Bio-Rad Laboratories, Inc.), and the supernatant of spun-down tubes contained the extracted DNA used in our study46. Plasmodium falciparum positive controls were derived from cultured 3D7 parasites, and negative controls were derived from blank filter paper. A standard curve was created using samples ranging from 10% to 0.000001% parasitemia (500,000 parasites/μL to 50 parasites/mL) for each qPCR run of sorbitol-synchronized ring-stage 3D7 parasites serially diluted in whole blood, run in duplicate (Supplementary Fig. 9)57. For highly sensitive parasite detection, we conducted qPCR targeting the var gene acidic terminal sequence (varATS, 59 copies/genome) which has a published LoD of 60–150 parasites/mL for ring-stage cultured 3D7 parasites13. For speciation, an initial round of Plasmodium genus-specific PCR was accomplished using the following primers, rPLU 6 TTAAAATTGCAGTTAAAACG and rPLU 5 CCTGTTGTTGCCTTAAACTTC44. This was followed by nested species-specific PCR targeting 18S small subunit ribosomal DNA, conducted in duplicate44. The species-specific primers used were Pf (rFAL 1 TTAAACTGGTTTGGGAAAAC CAAATATATT, rFAL 2 ACACAATGAACTCAATCATGACTACCCGTC), Pv (rVIV 1 CGCTTCTAG CTTAATCCACATAACTGATAC, rVIV 2 ACTT CCAAGCCGAAGCAAAGAAAGTCCTTA), Pm (rMAL 1 ATAACATAGTTGTACGTTAAGAATAA CCGC, rMAL 2 AAAATTCCCATGCATAAAAAA TTATACAAA), and Po (rOVA 1 ATCTCTTTTGC TATTTTTTAGTATTGGAGA, rOVA 2 GGAAAA GGACACATTAATTGTATCCTAGTG)44.
Diagnostic performance, quantitative agreement, and sample size analyses
Microscopy, RDT, and molecular assays were conducted by the Yale and Cameroon teams, who were blinded to the Cytophone results. All samples were classified qualitatively (positive or negative for malaria) and quantitatively (peaks/minute for Cytophone and parasites/mL for microscopy and qPCR). The LoD for the varATS qPCR assay in our study was determined using the mean parasite density and standard deviations of negative control samples and low-concentration samples of cultured 3D7 Pf parasites45. For speciation, the presence of Pf, Pv, Pm, and Po was determined by microscopy and nested PCR. Positive controls for nested PCR included Pf strain 3D7 (MRA-102) and 18S rRNA plasmid DNA for Pv (MRA-178), Pm (MRA-179), and Po (MRA-180) (Bei Resources, Manassas, VA). Highly sensitive varATS qPCR was considered the overall gold standard for Pf detection due to its superior sensitivity to current POC diagnostics. Microscopy was considered the gold standard for available POC methods. Rates of concordant and discordant results were used to calculate the sensitivity, specificity, PPV, NPV, and accuracy of each diagnostic. ROC-AUC curves were created to measure the performance in comparison to the gold standard by plotting the true positive rate (sensitivity) against the false positive rate (1–specificity). For each ROC-AUC curve, the AUC was calculated as the diagnostic performance or the probability that the diagnostic will rank a randomly chosen positive sample higher than a randomly chosen negative sample58. As a general rule for diagnostic performance, ROC-AUC values of 0.5, 0.51–0.69, 0.7–0.79, and 0.8–0.89 represent a random classifier, poor, acceptable, and excellent performance59. Additionally, the Youden index was calculated for all points on the ROC-AUC, with the maximum Youden index value indicating each diagnostics’ optimum parasite density cut-off point for identifying varATS-positive samples60. The reference diagnostic standard for species detection was nested PCR. The correlation between varATS, microscopy, and Cytophone quantitative results was calculated using linear regression and the Pearson correlation coefficient. A level of agreement analysis was not possible with Cytophone data because the quantitative output is not parasite density. NCSS 2021, v21.0.4 (NCSS, LLC) was used for all diagnostic performance and correlation analyses, and Microsoft® Excel® 2019 MSO (Version 2206 Build 16.0.15330.20260) 64-bit was used to create tables and figures.
For the Hanley-McNeil method of ROC curve area under the curve analysis with continuous data, the sample size to produce a 95% lower confidence bound with a distance of 0.1 from the sample area under the curve of 0.70 (the cutoff for acceptable diagnostic performance) to the lower limit were 116 and 76 for sample malaria prevalence of 25% and 50%, respectively. To accommodate an estimated combined participant dropout, missing visits, and excluded data rate of 20%, we estimated the need to enroll n = 26 participants in the longitudinal phase of the study. PASS 2019, v19.0.10 (NCSS, LLC) was used for all sample size and power calculations.
Reporting summary
Further information on research design is available in the Nature Portfolio Reporting Summary linked to this article.